

How to visualise hierarchical data (data in the shape of trees) using D3.js. This article shows how to create a nested (or hierarchical) data structure from an array of data. It also covers visualising hierarchies using D3, including treemaps, circle packing and sunburst charts.
A common technique when analysing or visualising data is to organise your data into groups.
For example, here's some film data:
| Title | Distributor | Genre | Worldwide_Gross | Rotten_Tomatoes_Rating |
|---|---|---|---|---|
| Adaptation | Sony Pictures | Comedy | 22498520 | 91 |
| Air Bud | Walt Disney Pictures | Comedy | 27555061 | 45 |
| Air Force One | Sony Pictures | Action | 315268353 | 78 |
| Alex & Emma | Warner Bros. | Drama | 15358583 | 11 |
| Alexander | Warner Bros. | Adventure | 167297191 | 16 |
| Ali | Sony Pictures | Drama | 84383966 | 67 |
| Alice in Wonderland | Walt Disney Pictures | Adventure | 1023291110 | 51 |
| Alive | Walt Disney Pictures | Adventure | 36299670 | 71 |
| All the King's Men | Sony Pictures | Drama | 9521458 | 11 |
| Amadeus | Warner Bros. | Drama | 51973029 | 96 |
Let's group it according to Distributor and count the number of films in each group:
| Distributor | Count |
|---|---|
| Sony Pictures | 4 |
| Walt Disney Pictures | 3 |
| Warner Bros. | 3 |
You can also group by more than one category. For example let's group by Distributor, then group by Genre:
| Distributor | Genre | Count |
|---|---|---|
| Sony Pictures | Action | 1 |
| Comedy | 1 | |
| Drama | 2 | |
| Walt Disney Pictures | Adventure | 2 |
| Comedy | 1 | |
| Warner Bros. | Adventure | 1 |
| Drama | 2 |
In the world of spreadsheets, the above table is also known as a pivot table. If you're familiar with databases you can achieve similar affects using the SQL statement
GROUP BY.
The data how has a hierarchical structure. At the top level are Distributors (Sony Pictures, Walt Disney Pictures etc.) and at the next level are Genres (Action, Adventure, Comedy etc.).
You can think of a hiearchical structure as a tree-like struture where a root item (or 'node') splits into top level groups (Distributors in our example). Each top level group splits into second level groups (Genres in our example), and so on:
The topmost item (or node) is known as the root node. The bottommost items are known as leaves or leaf nodes. In the leaf nodes of the above example, the count is displayed under the dot.
You can also aggregate (or 'rollup') the groups in different ways. For example you can sum Worldwide_Gross:
| Distributor | Genre | Sum of Worldwide_Gross |
|---|---|---|
| Sony Pictures | Action | 315268353 |
| Comedy | 22498520 | |
| Drama | 93905424 | |
| Walt Disney Pictures | Adventure | 1059590780 |
| Comedy | 27555061 | |
| Warner Bros. | Adventure | 167297191 |
| Drama | 67331612 |
There are several ways in which hierarchical data can be visualised including trees, treemaps, packed circles and sunbursts. Each of these can be created using D3 and we'll cover each of them later in this chapter.
First we'll look at how D3 can help us create a hierarchical data structure from flat data.
Creating a hierarchy from an array of data
Given an array of data such as:
let data = [
  {
    "Title": "Adaptation",
    "Distributor": "Sony Pictures",
    "Genre": "Comedy",
    "Worldwide_Gross": 22498520,
    "Rating": 91
  },
  {
    "Title": "Air Bud",
    "Distributor": "Walt Disney Pictures",
    "Genre": "Comedy",
    "Worldwide_Gross": 27555061,
    "Rating": 45
  },
  {
    "Title": "Air Force One",
    "Distributor": "Sony Pictures",
    "Genre": "Action",
    "Worldwide_Gross": 315268353,
    "Rating": 78
  },
  ...
];
you can use D3's rollup function to group the data by any of the categorical properties. rollup is imported from the d3-array module.
The first argument of rollup is the array you want to group.
The next argument is a reduce function. This is a function that takes an array of values and outputs a single value. For example it might iterate through the array, summing one of the properties (such as Worldwide_Gross).
The remaining argument(s) are functions which specify which properties to group by.
Let's group by Distributor and Genre and sum Worldwide_Gross across the items in each group:
function sumWorldwideGross(group) {
  return sum(group, function(d) {
    return d.Worldwide_Gross;
  });
}

let groups = rollup(data,
                       sumWorldwideGross,
                       function(d) { return d.Distributor; },
                       function(d) { return d.Genre; }
                      );
In the above example rollup groups data by Distributor and Genre. Each of the groups is then passed into sumWorldwideGross which returns the sum of Worldwide_Gross.
rollup returns a nested map object. (Maps, just like regular JavaScript objects, hold key-value pairs. You can read more about them here.)
You can inspect the map returned by rollup using .get:
// Get Sony Pictures
groups.get('Sony Pictures');  // {"Comedy" => 22498520, "Action" => 315268353, "Drama" => 93905424}

// Get Drama within Sony Pictures
groups.get('Sony Pictures').get('Drama');  // 93905424
The first .get returns the group associated with Sony Pictures. This group contains 3 items: Comedy, Action and Drama. (You can compare this with the table we showed previously.)
The second .get returns the value associated with Drama within the Sony Pictures group (93905424). This returns the value computed by the rollup function (sumWorldwideGross) because we're at the lowest level of the hieararchy.
hierarchy structure
D3 has a bespoke hierarchy data structure that gives you some useful features over and above the map object seen previously.
It's created by calling hierarchy (imported from d3-hierarchy) and passing in the map object generated by rollup:
function sumWorldwideGross(group) {
  return sum(group, function(d) {
    return d.Worldwide_Gross;
  });
}

let groups = rollup(data,
                       sumWorldwideGross,
                       function(d) { return d.Distributor; },
                       function(d) { return d.Genre; }
                      );

let root = hierarchy(groups);
You can also pass a nested object into
hierarchy. The layout examples later on use this approach.
The output of hierarchy is a nested object that looks something like:
{
  data: [undefined, Map(3)],
  children: [
    {
      data: ["Sony Pictures", Map(3)],
      children: [...],
      depth: 1,
      height: 1,
      parent: {...} // this item's parent node
    }.
    {
      data: ["Walt Disney Pictures", Map(2)],
      children: [...],
      depth: 1,
      height: 1,
      parent: {...} // this item's parent node
    }.
    {
      data: ["Warner Bros.", Map(3)],
      children: [...],
      depth: 1,
      height: 1,
      parent: {...} // this item's parent node
    }
  ],
  depth: 0,
  height: 2,
  parent: null
}
It's similar in structure to the map object that's passed into hierarchy. The difference is that it's a regular JavaScript object and has various properties and methods defined on it that provides additional functionality.
Each item (or node) in the hierarchy has properties: data, children, depth, height and parent.
data is the associated item from the map or object that's passed into hierarchy. In this example it's a two-element array containing the group name and the group's value. For leaf nodes (the nodes at the bottom-most level), the value is the aggregated value (for example, the sum of Worldwide_Gross). Otherwise, it's the map representing the items in the group. Typically you won't need to access the value because the hierarchy makes this data available through its children and value properties.
children is an array containing the node's children. depth and height indicate the depth and height of the node within the hierarchy. (The root node has a depth of zero and leaf nodes have a height of zero.)
parent references the node's parent node.
The leaf nodes look something like:
{
  data: ["Comedy", 22498520],
  depth: 2,
  height: 0,
  parent: {...} // this item's parent node
}
You can see that the data property contains the rolled up value. If the rolled up value is a sum or count, it can be be propagated back up the tree using the hierarchy's .sum method:
function sumWorldwideGross(group) {
  return sum(group, function(d) {
    return d.Worldwide_Gross;
  });
}

let groups = rollup(data,
                       sumWorldwideGross,
                       function(d) { return d.Distributor; },
                       function(d) { return d.Genre; }
                      );

let root = hierarchy(groups);
root.sum(function(d) {
  return d[1];
});
The .sum method takes an accessor function whose first parameter is the node's data property. The accessor function returns the value to sum by.
If you're passing the output of
rollupintohierarchy, the accessor function will usually returnd[1]which is the rolled up value generated byrollup.
Each leaf node will now have a value property equivalent to its rolled up value. For example:
{
  data: ["Comedy", 22498520],
  depth: 2,
  height: 0,
  parent: {...}, // this item's parent node
  value: 22498520
}
The non-leaf nodes will also have a value property which is the sum of the values of its children.
{
  data: ["Sony Pictures", Map(3)],
  depth: 1,
  height: 1,
  parent: {...}, // this item's parent node
  value: 431672297
}
The
.valueproperty generated by the.summethod is used by some of the layouts we'll cover later such as treemap and packed circles.
Each node in a D3 hierarchy has handy methods such as .descendants, .ancestors and .links.
.descendants returns an array containing the node and its descendants. .ancestors returns an array containing the node and its ancestors (all the way to the root).
.links returns an array of objects representing the connections between the node and its children, all the way to the leaves. We'll see this in use later on.
Visualising hierarchies
There are several ways in which hierarchies can be visualised including trees:
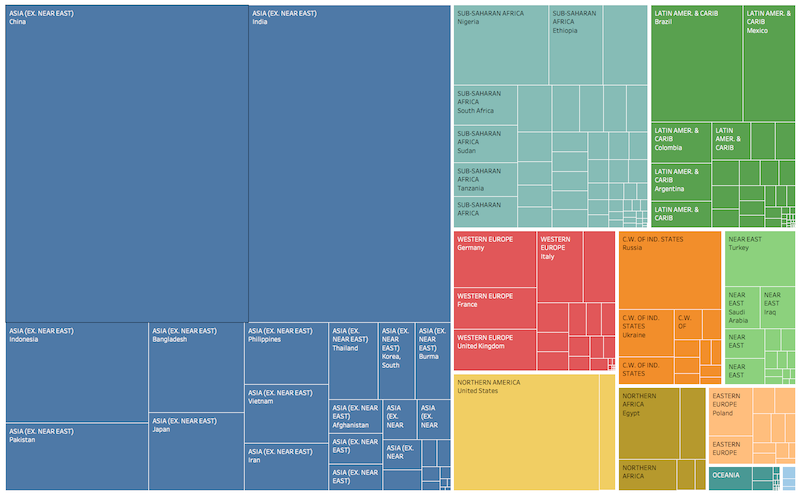
treemaps:
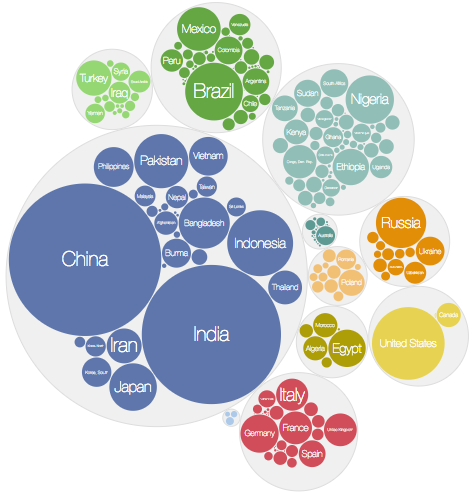
packed circles:
and sunburst charts:
You can also use stacked bar charts for visualising hierarchies!
D3 supports the above visualisations using layout functions. These take a hierarchy structure and add visual variables such as position and size to it.
For example the tree layout adds x and y values to each node such that the nodes form a tree-like shape.
In this page we look at the tree, cluster, treemap, pack and partition layouts, all of which are imported from the d3-hierarchy module.
Note that treemap, pack and partition are designed to lay out hierarchies where the nodes have an associated numeric value (e.g. revenue, population etc.).
Tree layout
The tree layout arranges the nodes of a hierarchy in a tree like arrangement.
Start by creating a tree layout function using tree():
let treeLayout = tree();tree() returns a layout function into which you can pass a hierarchy object.
You can configure the tree's size using .size:
treeLayout.size([400, 200]);You can then call treeLayout, passing in the hierarchy object root that was defined above:
treeLayout(root);This'll write x and y values on each node of root.
To draw the nodes:
- use
root.descendants()to get an array of all the nodes - join this array to circles (or any other type of SVG element)
- use
xandyto position the circles
To draw the links:
- use
root.links()to get an array of all the links - join the array to line (or path) elements
- use
xandyof the link'ssourceandtargetproperties to position the line
root.links()returns an array where each element is an object containing two propertiessourceandtargetwhich represent the link's source and target nodes.
// Nodes
select('svg g.nodes')
  .selectAll('circle.node')
  .data(root.descendants())
  .join('circle')
  .classed('node', true)
  .attr('cx', function(d) {return d.x;})
  .attr('cy', function(d) {return d.y;})
  .attr('r', 4);

// Links
select('svg g.links')
  .selectAll('line.link')
  .data(root.links())
  .join('line')
  .classed('link', true)
  .attr('x1', function(d) {return d.source.x;})
  .attr('y1', function(d) {return d.source.y;})
  .attr('x2', function(d) {return d.target.x;})
  .attr('y2', function(d) {return d.target.y;});
For simplicity, in this and the following CodePen examples, a hierarchy object is created from a nested object (rather than from an array).
Cluster layout
The cluster layout is very similar to the tree layout the main difference being all leaf nodes are placed at the same depth.
let clusterLayout = cluster()
  .size([400, 200]);

let root = hierarchy(data);

clusterLayout(root);
Treemap layout
Treemaps were invented by Ben Shneiderman to visually represent hierarchies where each item has an associated value.
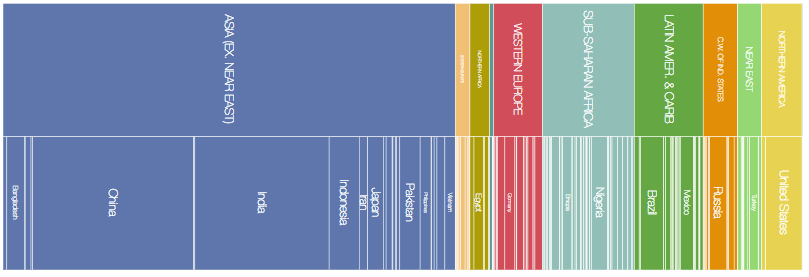
For example, imagine you have country population data where each country has a region and a population value.
You can use a treemap to represent each region as a rectangle. Each region consists of smaller rectangles which represent a country. Each country is sized proportionally to the population:
Create a treemap layout function by calling treemap() :
let treemapLayout = treemap();As before you can configure the layout:
treemapLayout
  .size([400, 200])
  .paddingOuter(10);
Before applying this layout to your hierarchy you must run .sum() on the hierarchy. This traverses the tree and sets .value on each node to be the sum of its children:
root.sum(function(d) {
  return d.value;
});
Note an accessor function has been passed into
.sum()to specify which property to sum.
You can now call treemapLayout, passing in the hierarchy object root that was defined earlier:
treemapLayout(root);The treemap layout function adds 4 properties x0, x1, y0 and y1 to each node which specify the dimensions of each rectangle in the treemap.
Now you can join the nodes to rect elements and update the x, y, width and height properties of each rect:
select('svg g')
  .selectAll('rect')
  .data(root.descendants())
  .join('rect')
  .attr('x', function(d) { return d.x0; })
  .attr('y', function(d) { return d.y0; })
  .attr('width', function(d) { return d.x1 - d.x0; })
  .attr('height', function(d) { return d.y1 - d.y0; })
If you'd like labels in each rectangle you can join g elements to the array and add rect and text elements to each g:
let nodes = select('svg g')
  .selectAll('g')
  .data(rootNode.descendants())
  .join('g')
  .attr('transform', function(d) {return 'translate(' + [d.x0, d.y0] + ')'})

nodes
  .append('rect')
  .attr('width', function(d) { return d.x1 - d.x0; })
  .attr('height', function(d) { return d.y1 - d.y0; })

nodes
  .append('text')
  .attr('dx', 4)
  .attr('dy', 14)
  .text(function(d) {
    return d.data.name;
  })
treemap layouts can be configured in a number of ways:
- the padding around a node's children can be set using
.paddingOuter - the padding between sibling nodes can be set using
.paddingInner - outer and inner padding can be set at the same time using
.padding - the outer padding can also be fine tuned using
.paddingTop,.paddingBottom,.paddingLeftand.paddingRight.
In the above example paddingTop is 20 and paddingInner is 2.
Treemaps have more than one strategy for arranging the rectangles. D3 has a few built-in ones such as treemapBinary, treemapDice, treemapSlice, treemapSliceDice and treemapSquarify.
treemapBinary strives for a balance between horizontal and vertical partitions, treemapDice partitions horizontally, treemapSlice partitions vertically, treemapSliceDice alternates between horizontal and vertical partioning and treemapSquarify allows the aspect ratio of the rectangles to be influenced.
You can select a tiling strategy using the .tile method:
treemapLayout.tile(treemapDice)The effect of different squarify ratios can be seen here.
Pack layout
The pack layout is similar to the tree layout but circles are used to represent nodes.
In this example each country is represented by a circle (sized according to population) and the countries are grouped by region.
Create a pack layout function using pack():
let packLayout = pack();As before you can configure its size by passing an array [width, height] into the .size method:
packLayout.size([300, 300]);As with the treemap you must call .sum() on the hierarchy object root before applying the pack layout:
rootNode.sum(function(d) {
  return d.value;
});

packLayout(rootNode);
The pack layout adds x, y and r (for radius) properties to each node.
Now you can join circle elements to each descendant of root:
select('svg g')
  .selectAll('circle')
  .data(rootNode.descendants())
  .join('circle')
  .attr('cx', function(d) { return d.x; })
  .attr('cy', function(d) { return d.y; })
  .attr('r', function(d) { return d.r; })
Labels can be added by creating g elements for each descendant:
let nodes = select('svg g')
  .selectAll('g')
  .data(rootNode.descendants())
  .join('g')
  .attr('transform', function(d) {return 'translate(' + [d.x, d.y] + ')'})

nodes
  .append('circle')
  .attr('r', function(d) { return d.r; })

nodes
  .append('text')
  .attr('dy', 4)
  .text(function(d) {
    return d.children === undefined ? d.data.name : '';
  })
The padding around each circle can be configured using .padding():
packLayout.padding(10)Partition layout
The partition layout subdivides a rectangular space into layers, each of which represents a layer in the hierarchy. Each layer is further subdivided for each node in the layer:
Create a partition layout function using partition():
let partitionLayout = partition();As before you can configure its size by passing an array [width, height] into the .size method:
partitionLayout.size([400, 200]);As with the treemap you must call .sum() on the hierarchy object root and before applying the partition layout:
rootNode.sum(function(d) {
  return d.value;
});

partitionLayout(rootNode);
The partition layout adds x0, x1, y0 and y1 properties to each node.
You can now join rect elements to each descendant of root:
select('svg g')
  .selectAll('rect')
  .data(rootNode.descendants())
  .join('rect')
  .attr('x', function(d) { return d.x0; })
  .attr('y', function(d) { return d.y0; })
  .attr('width', function(d) { return d.x1 - d.x0; })
  .attr('height', function(d) { return d.y1 - d.y0; });
Padding can be added between nodes using .padding():
partitionLayout.padding(2);If you'd like to change the orientation of the partition layout so that the layers run left to right you can swap x0 with y0 and x1 with y1 when defining the rect elements:
  .attr('x', function(d) { return d.y0; })
  .attr('y', function(d) { return d.x0; })
  .attr('width', function(d) { return d.y1 - d.y0; })
  .attr('height', function(d) { return d.x1 - d.x0; });
You can also map the x dimension into a rotation angle and y into a radius to create a sunburst partition: